Observability - Keeping Business-Critical Applications Healthy
Your applications generate a vast amount of metrics and analyses. Managing this data deluge is crucial to ensuring the health and performance of your business-critical systems. At ConSol, we emphasize observability. We take a comprehensive approach to monitoring your IT applications, shielding you from unexpected outages that can cost you time, money, and, in the worst case, damage your reputation. Through Open Source Observability, we assist you with the design, tool selection, implementation, and integration of tracing, log aggregation, error management, and other observability practices.
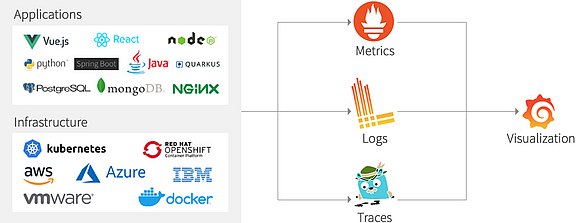
All applications and the underlying infrastructure produce metrics, logs, and where useful traces as well. These are gathered and prepared by proven open-source tools like Prometheus (metrics), Loki (logs) or Jaeger (traces). Subsequently, these data are centrally visualized in Grafana dashboards. At this point, the user gets an overview of the applications and infrastructure components he is sharing. For a long-term storage of data, additional data bases like InfluxDB can be employed.
Observability – Chasing „Mister X“
Observability is basically composed of three components: monitoring, logging, and tracing. The monitoring provides details, when a defined service level or quality criterion has fallen short of. For this, the application developers define appropriate metrics which again are being provided directly from the application. In the logs, we find the error reports of each individual software component. They point out the place in the various services where the error occurs. Tracing allows us to identify the path a call has taken in between services bevor resulting in a problem. By means of correlation IDs, we are able to observe all this information together in a central dashboard. This way we keep the overview even in complex applications and quickly track the source of error.









More than
200 customers
trust ConSol
for their
IT & Software
Observability Tools
For observability applications we favor mostly open-source solutions. Compared with commercial solutions, there is no disadvantage at all. For many years now, we use open-source solutions with our clients as well as in our own productive employment. They also offer a truly remarkable range of functions.

Prometheus is the de facto standard for cloud-native monitoring and alerting. It offers a simple configuration for where and how metrics can be collected. Most applications support the export of metrics to Prometheus. And there is also great support for exporting metrics to Prometheus for self-written applications in all common programming languages.

Loki allows for a simple importing and indexing of logs. Its configuration is derived from Prometheus and aims at quickly finding logs for certain criteria. Therefore, only a very small index can be written. By severe parallelizing the analyses, enquiries can be quickly executed even with large amounts of data.

Grafana is used to visualize metrics. It offers a very good integration of Prometheus, Loki and Jaeger and allows for metrics as well as traces to be displayed in the graphs. It is also possible to jump directly to individual traces and for certain metrics to display the logs to these metrics. Besides a great choice of predefined dashboards with various metrics, the user can also create dashboards himself.

Jaeger supports the OpenTracing standard, thus making it possible to easily integrate applications with Jaeger. For self created applications there is, quite like with Prometheus, a broad support of programming languages and frameworks. Other advantages of Jaeger besides its widespread use include its simple installation and scaling even with larger amounts of data.

ElasticSearch (and its open-source fork, OpenSearch) is utilized in a multitude of our log aggregation and tracing systems. Its diverse capabilities in terms of operation, data flow control, high availability, and data security make it the right solution in many environments. We provide support for system planning, setup, configuration, and integration.

The VictoriaMetrics framework is an efficient alternative to Prometheus for more complex infrastructures. It is available both as a free solution and as an enterprise version with advanced features, such as anomaly detection powered by AI technology.
Observability: Important Terms & Notes
Logging is used to record special events or problematic and faulty situations in order to be able to understand an error situation in the event of difficulties. How informative those recordings are, is up to the developers. For most programming languages there are logging frameworks providing standardized log formats. This becomes important, when logs are supposed to be collected centrally or to be found again in accordance with certain criteria. Since local log files are lost when restarting the container, a centralized log collection is mandatory, especially in volatile containers.
In todays distributed systems and especially in microservice architectures, simple logging is not sufficient anymore. The process has to be traceable through various services or methods, since it is often the interaction between microservices that results in problems or performance bottlenecks. This requires that, aside from the end-user calls, additional information on service calls is provided and stored in special tracing log events as well. Moreover, these tracing logs have also to be stored centrally for all services involved in order to be able to display the call hierarchy. When using external libraries or services, they too will have to meet those additional requirements.
Via OpenTracing there are frameworks for many programming languages available, making end-user calls easily assignable through various services via so-called spans or correlation IDs. This standard is already being supported by many open-source libraries.
Metrics are numerical representations of statuses (e. g. number of open connections) or throughputs (e. g. writing volume on a hard drive since a specific point in time, calling of a specific functionality). This way they differ from logs and tracing data relating to individual events.
Metrics can be queried of standard applications (e. g. NGINX, DBs or objects in Kubernetes) via so-called exporters or metric endpoints. Customer-specific applications should be instrumented in a way that allows to measure SLAs as well as to obtain further information on the usage (e. g. number and response time of critical calls) for detailed performance observations.
The currently widely used metrics format was introduced by Prometheus and standardized via OpenMetrics. Metric points here are composed as follows:
- Metrics name: describes what is represented, e. g. server_open_connection_count
- Labels: on the basis of labels, differently measured instances can be distinguished, e. g. instance=127.0.0.1:8080.
- Timestamp: at what time was this value valid?
- Value: numeric value
This way, the performance and where appropriate also the number of errors or specific statuses can be compactly represented and graphically visualized in Grafana.
Based on these numeric values, rules can be defined that provide a message if the system has exceeded limit values – e. g. if more than 90 % of the available connections were occupied for more than 10 minutes or if during 5 minutes an average of more than 2 % of the queries resulted in errors. A monitoring tool for metrics like Prometheus stores the metrics, checks these conditions, and can subsequently notify the ones in charge.
Monitoring refers to the controlling of application and infrastructure. In case of faulty statuses or performance bottlenecks, the operating teams in charge are being notified – ideally before the application’s users become aware of major problems.
State-of-the-art monitoring systems like Prometheus are metrics-based. In other words, they determine problematic statuses based on the metrics and then trigger alerts. In addition, they also store the metrics over an extended period of time. This way, with visualizing tools like Grafana these metrics can be used later on for an analysis of problematic situations as well.
A relatively new discipline within observability, error management focuses on the structured tracking of error messages occurring in the monitored software. Detected errors, such as those found in logs, are recorded and correlated with similar errors (so that a recurring error appearing 10,000 times generates only a single entry). SREs and software engineers are automatically alerted to new errors, enabling them to investigate and resolve issues more efficiently—far more effective than manually sifting through massive application logs!
Amid the myriad individual values in application metrics, crucial indicators of potential issues can be hidden—but how do you find that needle in the haystack? This is where anomaly detection comes into play, a fascinating use case for Artificial Intelligence (AI). In essence, an anomaly detection system automatically learns what observability data looks like when a system is functioning "normally."
Based on this understanding, the system can then automatically detect deviations from this normal operation (e.g., dramatically increased traffic, filling buffers, etc.) and issue warnings if necessary, even though it was never explicitly programmed to monitor specific metrics. This approach is a highly valuable complement to manually configured alerts, helping to identify "blind spots" in alert configurations and detect unforeseen problems in general.
Complex requirements - ConSol as a strong partner
Questions about Observability for Business-Critical Applications?

Let's talk!
Marc Mühlhoff





 Openshift Consulting
 Open Source Monitoring
 Integration-Testing


